Reports: AC8
46350-AC8 Experimental Investigation of the Effect of Pressure and Fluid Saturation on Carbonate Rocks
The dissolution rate of carbonate rocks is controlled by several chemical variables such as mineralogical stability, saturation state of the diagenetic fluid, and the available surface area for reaction. This latter is in turn controlled by two parameters: grain microstructure (i.e. grain arrangement) and size. Therefore, quantifying type and amount of carbonate solid components is fundamental to study the parameters controlling the softening of the rock frame and the poor agreement of observations with Gassmann's theory.
Whereas the classification of siliciclastics is based predominately on mineralogical composition, mono-mineralic carbonates are classified primarily by the relative amounts of (1) allochems (i.e., transported grains and fossils), (2) sparry carbonate cement (i.e., sparite), and (3) microcrystalline to cryptocrystalline calcite matrix (i.e., micrite) (Folk, 1959, 1962; Dunham, 1962). A first task of this 2nd year project has been quantifying the amount of fines in carbonates to understand both the variability of the transport and elastic properties and the factors controlling the role of the physicochemical mechanisms in carbonates.
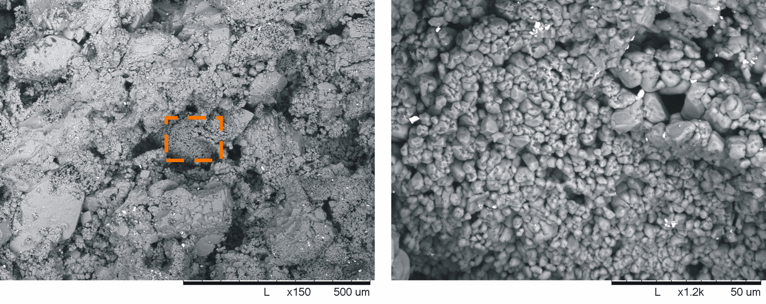
Quantifying the amount of the solid microporous matrix (as clay content is quantified in siliciclastics) has never been explored. This is not as simple as in siliciclastics because mineral composition (e.g. clay in quartzose sandstones) cannot be used as a discriminant. However, modern CT scanners can produce 3D images of the fabrics of rock samples with the high accuracy and resolution required for staging virtual experiments at the finest scale. We thus used micro-CT scans and image-processing techniques to quantify the amount of micrite in carbonate rocks. Because of their microporosity, micrite aggregates (Figure 1) have lower density than solid calcite grains, thus making it possible to discern them based on density contrast (and. by proxy. the intensity response) in CT images.
Figure 1: Micrite crystals filling the interstitial pores between the calcite grains of a carbonate rock (left); magnified patch of rounded micrite crystals (1-4 mm) (right).
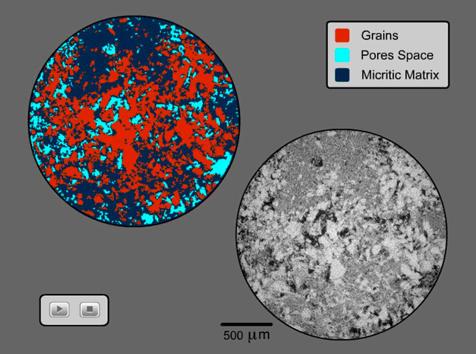
We selected 12 samples from the MA formation (for details, see 1st Year Report) covering the whole range of variability in velocity and permeability. Each sample was scanned with a spatial resolution of 4.5 mm, producing a 3D digital volume of the rock in a zero to 255 grayscale spectrum. Figure 2 shows a 2D slice of the scanned rock (right, lower corner), in which micrite matrix exhibits intermediate intensity response (gray) between the pore space (black) and solid grains (white). We performed a second-order segmentation of the images to differentiate solid grains (red, Figure 2 – upper left corner) from the micritic matrix (blue, Figure 2- upper left corner), thus quantifying micrite content in the measured rocks.
Figure 2: Micro-CT scan of a carbonate rock (lower right) showing the intensity response of micrite (gray), grains (white), and pores (black). Segmented image (upper left) showing the grains (red), micrite aggregates (blue), and pore space (cyan) (Vanorio et al., 2009).
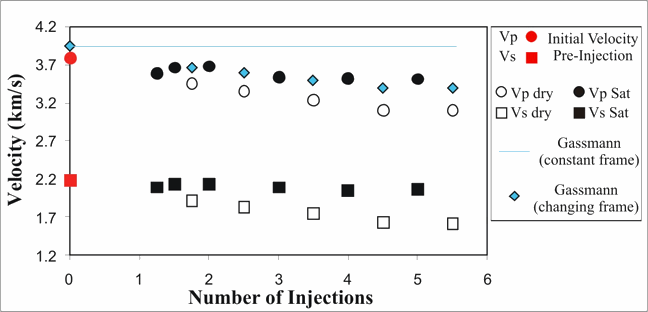
A 2nd task of this project has been studying the variation of P- and S- wave velocity upon injection of a reactive fluid (i.e carbonated water). Figure 3 shows the variation of P- and S- wave velocity upon several injection cycles of carbonated water in a carbonate rock. Confining and pore fluid pressure were kept constant during each injection cycle. Solid symbols denote velocities measured under full saturation, whereas open symbols denote the dry conditions after each injection cycle. Figure 3 shows that both P- and S- dry velocities decrease with more injection cycles, suggesting a change in the rock frame that might be due to porosity enhancement, changes in stiffness at the grain contacts, or the formation of new, softer mineral phases. In any case, the predicted Gassmann's VP (cyan line) based on constant properties of the frame overestimates the ultrasonic velocity.
All these physicochemical phenomena suggest that seismic fluid substitution, under conditions of a complex rock-fluid coupling, is likely to be more than a purely mechanical problem. Chemical effects such as mineralogical changes, dissolution, and precipitation induce changes in the properties of the rock frame (e.g. porosity, stiffness of the grain contacts, permeability), which in turn alter the baseline of Gassmann's equations.
Figure 3. Variation of dry (open symbols) and saturated (filled symbols) P- and S- wave velocity upon injection of carbonated water (pH=3.8) (data are from Vialle et al., 2009).


