Reports: AC7
46752-AC7 Kinetic Control of Epoxy Morphology and Its Effect on Moisture Diffusion
INTRODUCTION
Epoxy resins are a versatile class of thermosetting polymers, which are extensively used in composites and structural adhesives. Although their crosslink networks are generally treated as homogeneous, much evidence shows that there are nano-scale microstructures due to crosslink density variations in the cured epoxy resin matrix.1-5 Both the fracture toughness and water diffusion coefficient have been shown to correlate with the microstructure of epoxy resins and therefore, it is desirable to be able to control their microstructure. It has been proposed that the formation of this microstructure in epoxies follows three steps:1) Microgels nucleate and grow; 2) The microgels begin to interact, forming larger clusters; 3) At gelation the microgel particles and clusters form a continuous network with a higher crosslink density, while the resin between these clusters eventually reacts to form a phase with a lower crosslink density.1 Comparing this process to the reaction-induced phase separation process in rubber modified epoxy resins, the crosslink density heterogeneity of epoxy resins should be balanced by the reaction rate and phase separation speed, and governed by kinetic parameters, e.g.: the reactivity of the epoxy and hardener, curing temperature with regard to Tg of the resin system, and stoichiometry.6-8 In this study we provide initial results that show how the cure temperature and stoichiometry affect the final morphology.
RESULTS
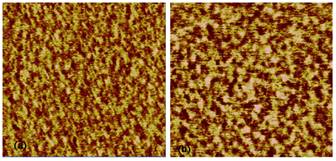
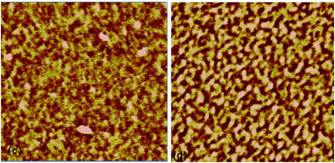
Atomic force microscopy tapping mode phase AFM images of microtomed surfaces of DGEBA cured by Jeffamine D 230 under various conditions appear in Figure 1. In these phase images, due to the moderate tapping setting in our AFM measurement, the phase contrast is related to the local viscoelasticity and the brighter region is considered to be stiffer with a higher crosslink density, while the darker region is considered to be more viscous and has a lower crosslink density. Figure 1 clearly shows the phase image of the cured epoxy resin has a two phase structure consisting of a highly crosslinked hard phase embedded in a matrix of a soft phase with a lower crosslink density. As shown in Figure 1, there is a difference in the size and distribution of brighter regions due to the influence of kinetic parameters such as temperature, amine to epoxy functional group ratio, and hardener reactivity.
DISCUSSION
The purpose of this study was to determine how changes in kinetic parameters such as temperature, amine to epoxy functional group ratio, and hardener reactivity affect the microstructure of epoxy cured by diamine. Figure 1 demonstrates that with proper control of these parameters, it is possible to control the microstructure of cured epoxy resins.
It has previously been shown that the microstructure of DGEBA cured by PACM 20 amine is affected by the epoxy to hardener ratio.1 In our study, a 20% increase in amine ratio, as shown from Figure 1 (top row), leads to an increase in the size of hard and soft phases, which is consistent with previous studies. Since epoxide groups tend to react with primary amines first, when more amine is present during the microgel formation process, more linear chains might form compared to stoichiometric formulations. As a result, phase separation is favored in amine rich formulations and larger size domains are formed
When the hardener was replaced with MDA which has a lower reactivity, the microstructure changed (bottom row of Figure 1). The phase domain size is increased and the phase boundary is better defined. This is might due to the fact that a slower curing rate could allow the chains more time to phase separate, while a fast curing rate might lock the chains up before the chains can relax into a thermodynamically more favorable arrangement.
Changes in curing temperature also altered the microstructure when comparing the images in the lefthand column. The domain size seems larger at the lower curing temperature and a few very large high crosslink density domains exist. Reaction rates should have an Arrhenius type dependence on temperature, while chain relaxations can be described by the WLF equation. Since the phase separation is balanced by these two factors, the overall effect is complicated. In future research, a quantitative analysis of these images to determine phase volume fractions and phase sizes to provide more insight into the process by which this microstructure is formed.
REFERENCES
1. Vanlandingham, M. R.; Eduljee, R. F.; Gillespie, J. W. J. Appl. Polymer Sci.1999, 71, 699.
2. Wu, W. L.; Bauer, B. J. Polymer 1986, 27, 169.
3. Gu, X. H.; Nguyen, T.; Oudina, M.; Martin, D.; Kidah, B.; Jasmin, J.; Rezig, A.; Sung, L. P.; Byrd, E.; Martin, J. W. Jct. Research 2005, 2, 547.
4. Vanlandingham, M. R.; Eduljee, R. F.; Gillespie, J. W. J. Appl. Polymer Sci.1999, 71, 787.
5. Kishi, H.; Naitou, T.; Matsuda, S.; Murakami, A.; Muraji, Y.; Nakagawa, Y. J. Polymer Sci. B Polymer Phys. 2007, 45, 1425.
6. Oyanguren, P. A.; Riccardi, C. C.; Williams, R. J. J.; Mondragon, I. J. Polymer Sc.i B Polymer Phys. 1998, 36, 1349.
7. Borrajo, J.; Riccardi, C. C.; Williams, R. J. J.; Siddiqi, H. M.; Dumon, M.; Pascault, J. P. Polymer 1998, 39, 845.
8. Inoue, T. Progr. Polymer Sci. 1995, 20, 119.