Reports: AC7
46305-AC7 Surface Grafted Poly(ionic liquid)s
Our goal is to develop the methodologies to create poly(ionic liquid) (pIL) nanolayers. The program objectives are to prepare pIL nanolayers by surface-initiated atom transfer radical polymerization (ATRP), to characterize the nanolayer structural properties and growth kinetics, and to conduct fundamental thermodynamic property measurements to evaluate pIL nanolayer performance for selective sorption of CO2. Our rationale is that results from our research will enable the design of membranes with ultrathin pIL separation layers to recover CO2 emissions generated by combustion of fossil fuels, thusly lessening the effect of global climate change.
Proposed objectives for this report period:
1. Grow structurally and chemically varied, surface-grafted poly(ionic liquid) nanolayers from idealized surfaces using atom transfer radical polymerization (Years 1-2).
2. Characterize the pIL nanolayer properties by FTIR, ellipsometry, AFM; growth kinetics by ellipsometry; and interfacial glass transition profiles by SM-SFM (Years 1-2).
3. Measure Henry's Law constants at 25 °C for CO2 in the pIL nanolayers and analyze how nanolayer chemistry and structure impact the results (Year 2).
Research progress
Previously, we described our methodology to prepare pIL nanolayers. Briefly, we use surface-initiated ATRP in a methanol/water solvent to graft poly[2-(methylacryloyloxy)ethyl-trimethylammonium chloride] chains from poly(glycidyl methacrylate)-coated silicon or cellulose substrates, and then carry out an ion exchange reaction on the grafted polymer to replace Cl- with BF4-, CH3SO3-, and CF3SO3-. We used XPS to verify that ion exchange reactions are quantitative.
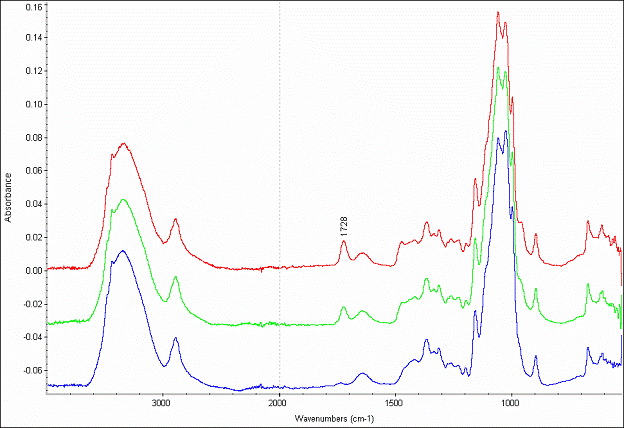
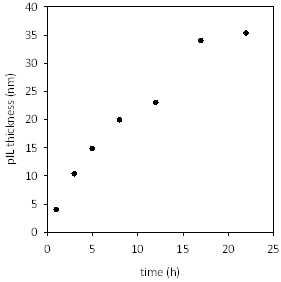
Figure 1 shows a representative set of ATR-FTIR spectra using cellulose substrate. The peak at 1724 cm-1 for modified substrates is assigned to the C=O stretching mode of the methacrylate backbone, confirming that polymerization was successful. Poly[(META)Cl] layer thickness evolution was monitored by ex-situ ellipsometry. Figure 2 shows the evolution of layer thickness with time. The near linear thickness increase with time indicates reasonably good control over polymer growth.
Figure 1. ATR-FTIR spectra for cellulose supports: unmodified (bottom); poly[(META)Cl-]-modified, 5 h polymerization (middle); and 24 h polymerization (top).
Figure 2. Nanolayer thickness versus time for surface-initiated ATRP of [2-(methylacryloyloxy)ethyl]trimethylammonium chloride at 25 °C.
In order to vary chain density on the surface, we needed to design a method to vary ATRP initiator density. A direct way is to vary the mass (thickness) of the poly(gylcidyl methacrylate) anchor layer. We studied two methods to control layer thickness: dip-coating at different speeds and solution casting with solutions of different concentration. Tables 1 and 2 show the results that demonstrate successful variation of layer thickness using both methods.
Table 1. Dry layer thickness of PGMA versus dipping speed, using a constant PGMA concentration.
|
Speed (cm/s)
|
0.043
|
0.072
|
0.091
|
0.127
|
0.163
|
0.395
|
|
Thickness (nm)
|
5.0-6.0
|
6.0-7.0
|
7.0-7.5
|
9.0-10.0
|
9.0-10.5
|
10.0-10.5
|
Table 2. Dry layer thickness of PGMA versus concentration during solvent casting.
|
Concentration (wt%)
|
0.2 × 10⁻³
|
0.03
|
0.2
|
|
Thickness (nm)
|
5.0-7.0
|
7.0-8.0
|
12-14
|
What remains for Objective 1 is to use our
poly(glycidyl methacrylate) platform to grow pIL nanolayers with variation in
grafting density. What remains for Objective 2 is to measure growth kinetics
for these nanolayers with different grafting densities. Originally, we planned
to use SM-SFM to measure interfacial Tg values for the pIL
nanolayers. We decided that a better technique would be in-situ spectroscopic
ellipsometry to measure glass transition pressure (Pg), defined as
the pressure required to have sufficient sorbed CO2 in the polymer
layer to lower the Tg to the experimental temperature. This
measurement is important to understand pIL plasticization by CO2. We
have begun to fabricate a high-pressure ellipsometry cell to conduct these
measurements. Once completed, we will determine Pg at a temperature
above the critical temperature of CO2 by measuring the ellipsometric
angle ![]() as a
function of gas pressure at different wavelengths (400-800 nm). The
gas-induced Pg is given as the pressure at which the slope of the
as a
function of gas pressure at different wavelengths (400-800 nm). The
gas-induced Pg is given as the pressure at which the slope of the ![]() -pressure curve changes.
-pressure curve changes.
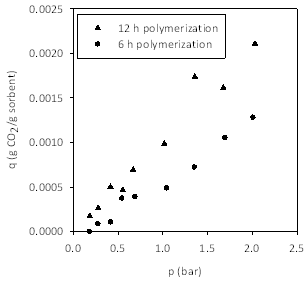
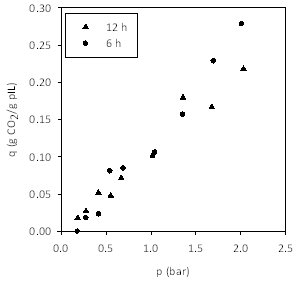
Figure 3 shows the adsorption isotherms for CO2 on poly[(META)CF3SO3-]-modified cellulose supports. The two figures show the same data plotted per mass of sorbent and per mass of pIL. The latter figure shows that CO2 capacity is independent of nanolayer thickness. Thus, remaining figures are plotted on a basis of mass of pIL.
Figure 3. Adsorption isotherms at 25 °C for CO2 on poly[(META)CF3SO3-]-modified cellulose supports. (Left) Impact of graft polymerization time. Data presented per mass of sorbent material. (Right) Data presented per mass of pIL, which shows that the capacity (per mass of pIL) is independent of nanolayer thickness.
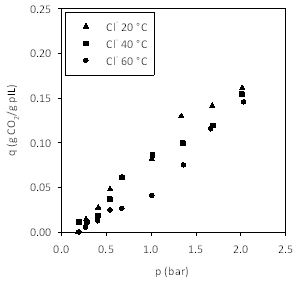
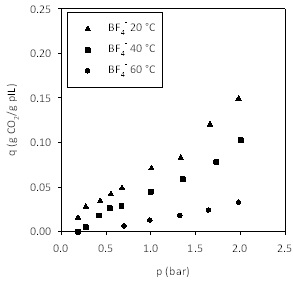
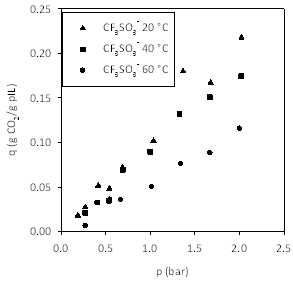
Figures 4-7 show the adsorption isotherms for CO2 on the pILs prepared using four different anions. We decided to prepare isotherms at three temperatures, rather than a single temperature, as this allowed us to measure enthalpies of adsorption.
Figure 4. Effect of temperature on CO2 capacity in poly[(META)Cl-].
Figure 5. Effect of temperature on CO2 capacity in poly[(META)BF4-]
Figure 6. Effect of temperature on CO2 capacity in poly[(META)CH3SO3-]
Figure 7. Effect of temperature on CO2 capacity in poly[(META)CF3SO3-]
Using the measured adsorption isotherm data at low pressures, Henry's constants (bar/wt. fraction) were extracted according to Equation 1:
wCO2 represents the mass fraction of CO2 in the pIL phase, and its fugacity, fCO2, is replaced by partial pressure at the low pressures used. Table 3 gives the Henry's constants for CO2 in the four pIL materials at all three temperatures.
Table 3. Henry's constants for carbon dioxide in the poly(ionic liquids) at three temperatures.
|
Temperature
|
HCO2,pIL (bar/wt. fraction)
|
|||
|
Cl-
|
BF4-
|
CH3SO3-
|
CF3SO3-
|
|
|
20 °C
|
9
|
14
|
15
|
9
|
|
40 °C
|
12
|
19
|
17
|
11
|
|
60 °C
|
17
|
50
|
26
|
18
|
With these values, the enthalpies of adsorption were calculated using Equation 2:
Table 4 gives the molar enthalpies of adsorption, which range from 11-26 kJ/mol, indicating that CO2 adsorption is strong. Large enthalpies of adsorption translate to high selectivity over non-adsorbing species like the permanent gases. Measurements with N2 showed no measureable adsorption at the highest pressure studied.
Table 4. Enthalpy change of adsorption for carbon dioxide on the poly(ionic liquids).
|
Anion
|
DHads (kJ/mol)
|
|
Cl-
|
13
|
|
BF4-
|
26
|
|
CH3SO3-
|
11
|
|
CF3SO3-
|
14
|
A journal manuscript will be submitted by December to disseminate these results.

